The My Data tab shows different aspects of the matches between your account-specific hashed emails and the corresponding data in the ADARA Data Consortium.
13.2.1. Information
ADARA shows aspects of your data and the matches in the ADARA Data Consortium::
| Type | Definition |
|---|---|
| My Data statistics | This sections shows the number of Identifiers, Unique Identifiers, the Identifier Type, the File Size, and the Last Data Uploaded On date and time. |
| Top Channel Matches | This section shows the channels with the highest number of matched identities in common with the uploaded file of hashed emails. |
| Venn diagram | This section shows the overlap of My Data and the ADARA Consortium. |
| Discretionary Spenders statistics | Discretionary Spend Tier indicates an identity's spending ability/tier for discretionary activities including experiences, dinning, travel, and real estate/finance. Tiers are ranked from Tier 1 to Tier 4, where Tier 4 contains the highest discretionary spenders.
|
| Recent Activity Distribution | Event Recency reflects the time between the analysis and the last event that ADARA partners recorded for the identity. A more recent timestamp indicates that the identity is still active and more likely to be a reliable identity.
|
| Digital Recognition Score | The DRS is a wide coverage score that measures both the quality and health of an identity and its proximity to or availability for digital transactions. This composite score is derived based on features of actual online activities observed. Each identity is scored between 0 and 100, and a higher score translates to a higher quality.
|
| Audience Match Rate Distribution | This section shows the audiences in the ADARA Data Consortium with best match rates to your uploaded file of hashed emails, indexed against the number of matching prospects/identities that you could reach in those audiences. |
The Audience Match Rate Distribution graph highlights a handful of the 5000+ segments that ADARA curates and makes available via Cortex. For more information on Cortex and these audiences, visit https://adara.com/cortex/.
13.2.2. Interface
For the graph panels:
- Select the three bars icon for more information.
- Hover over a graph element to view more details.

- Select *Back *at any time to close the dashboard and return to the corresponding client view.
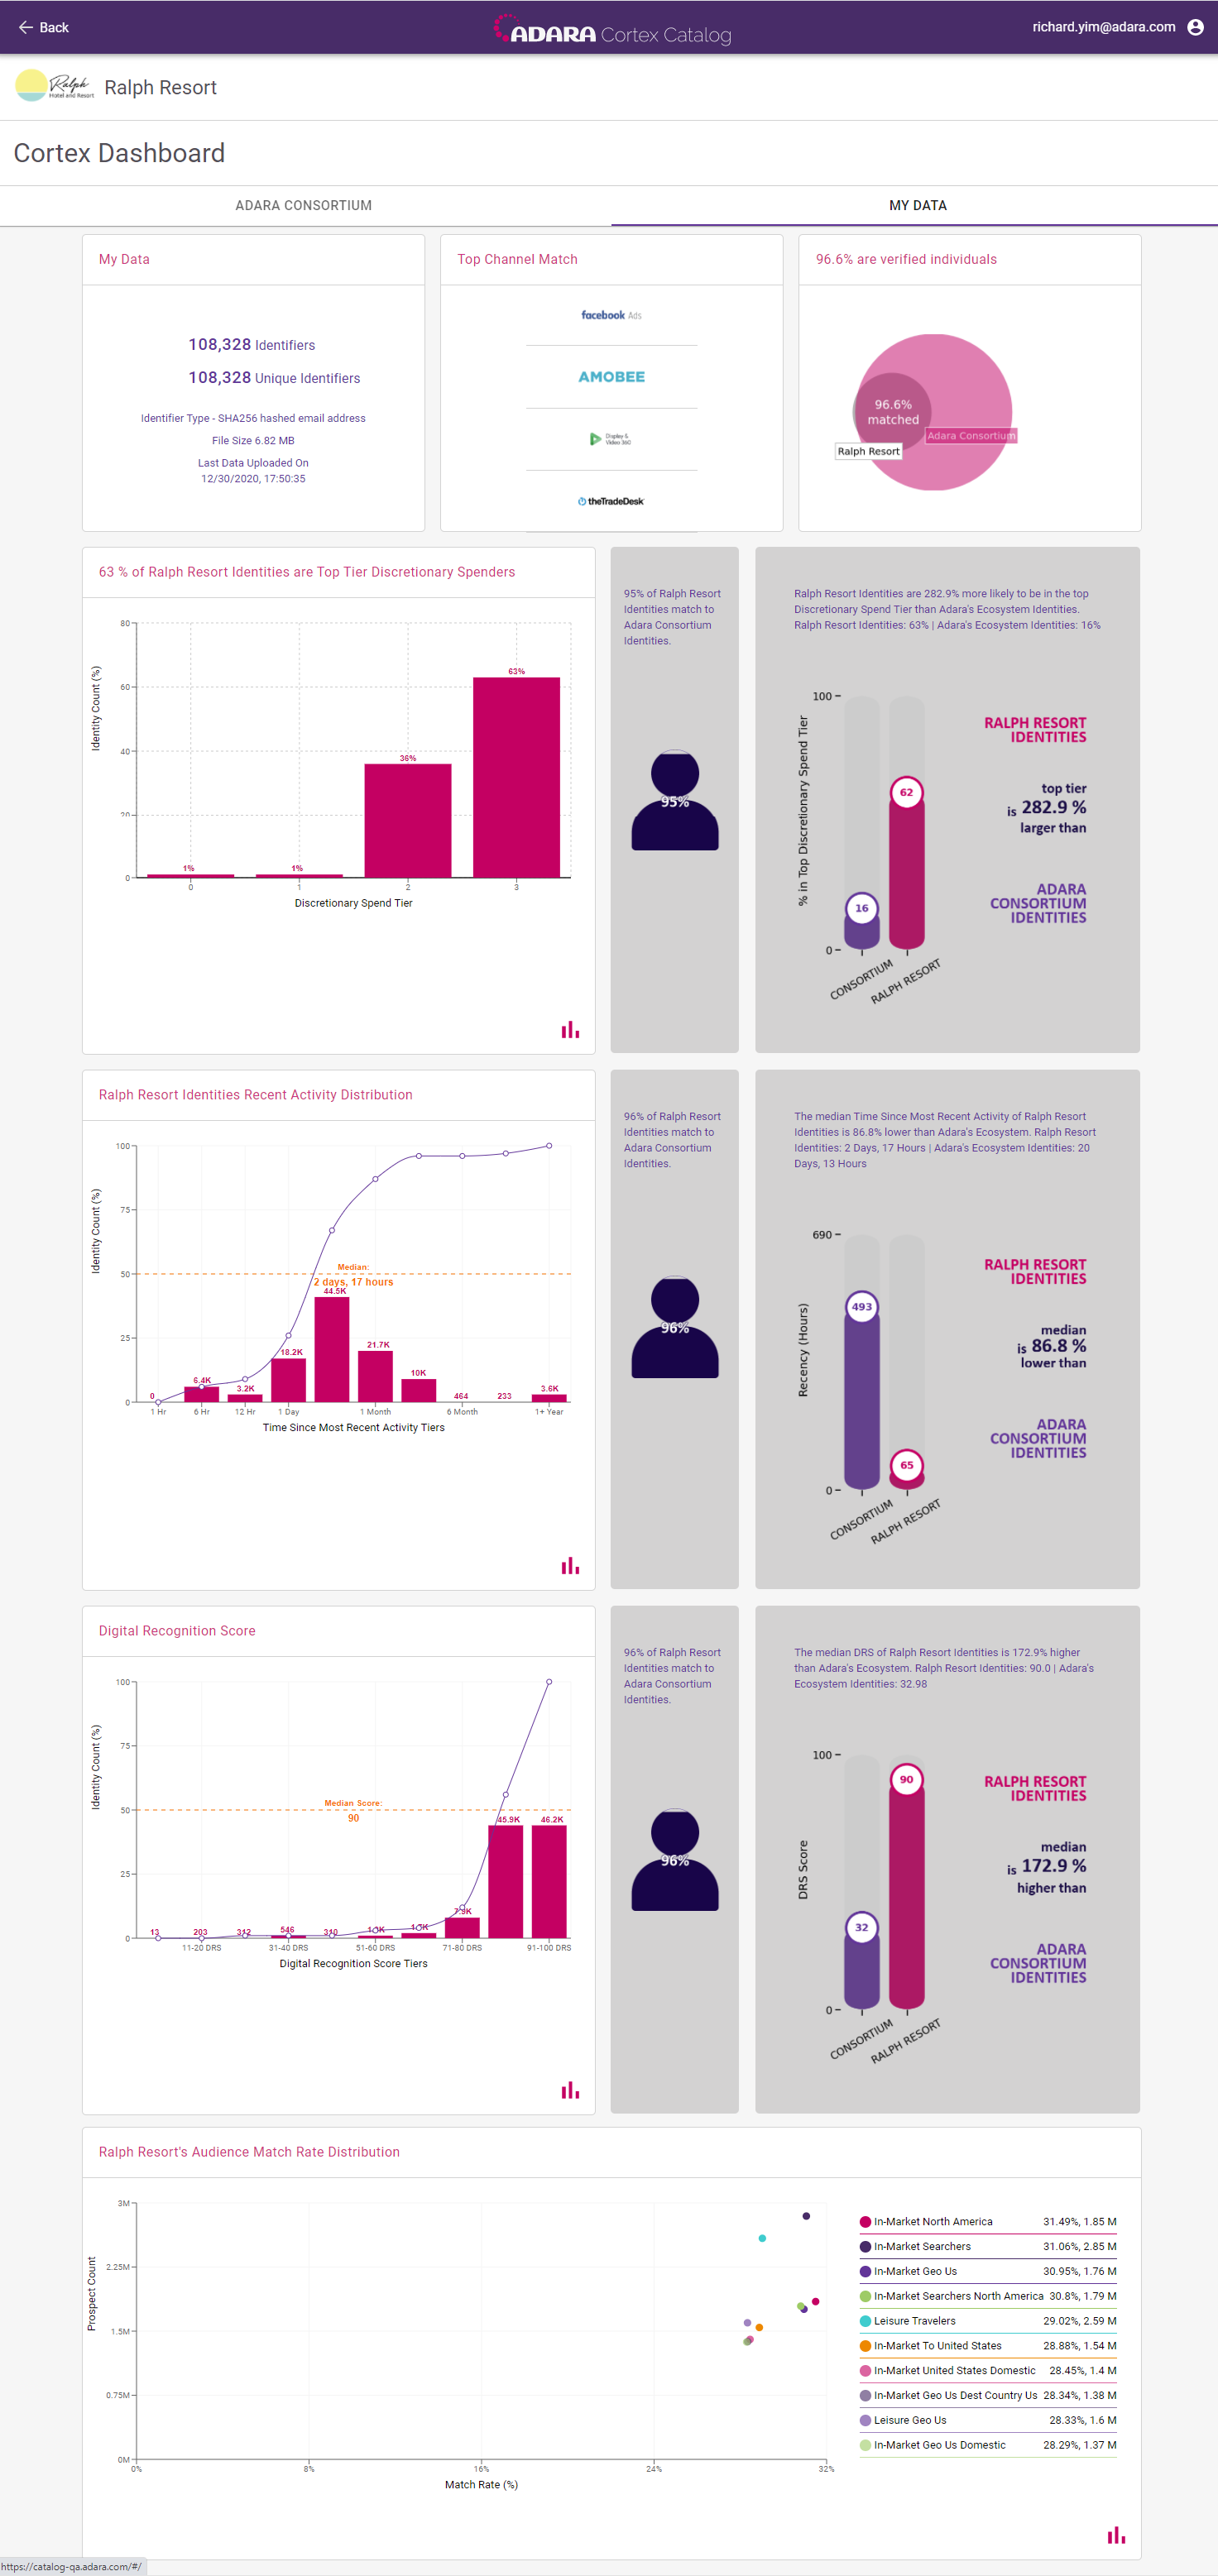
Cortex Catalog - My Data Tab