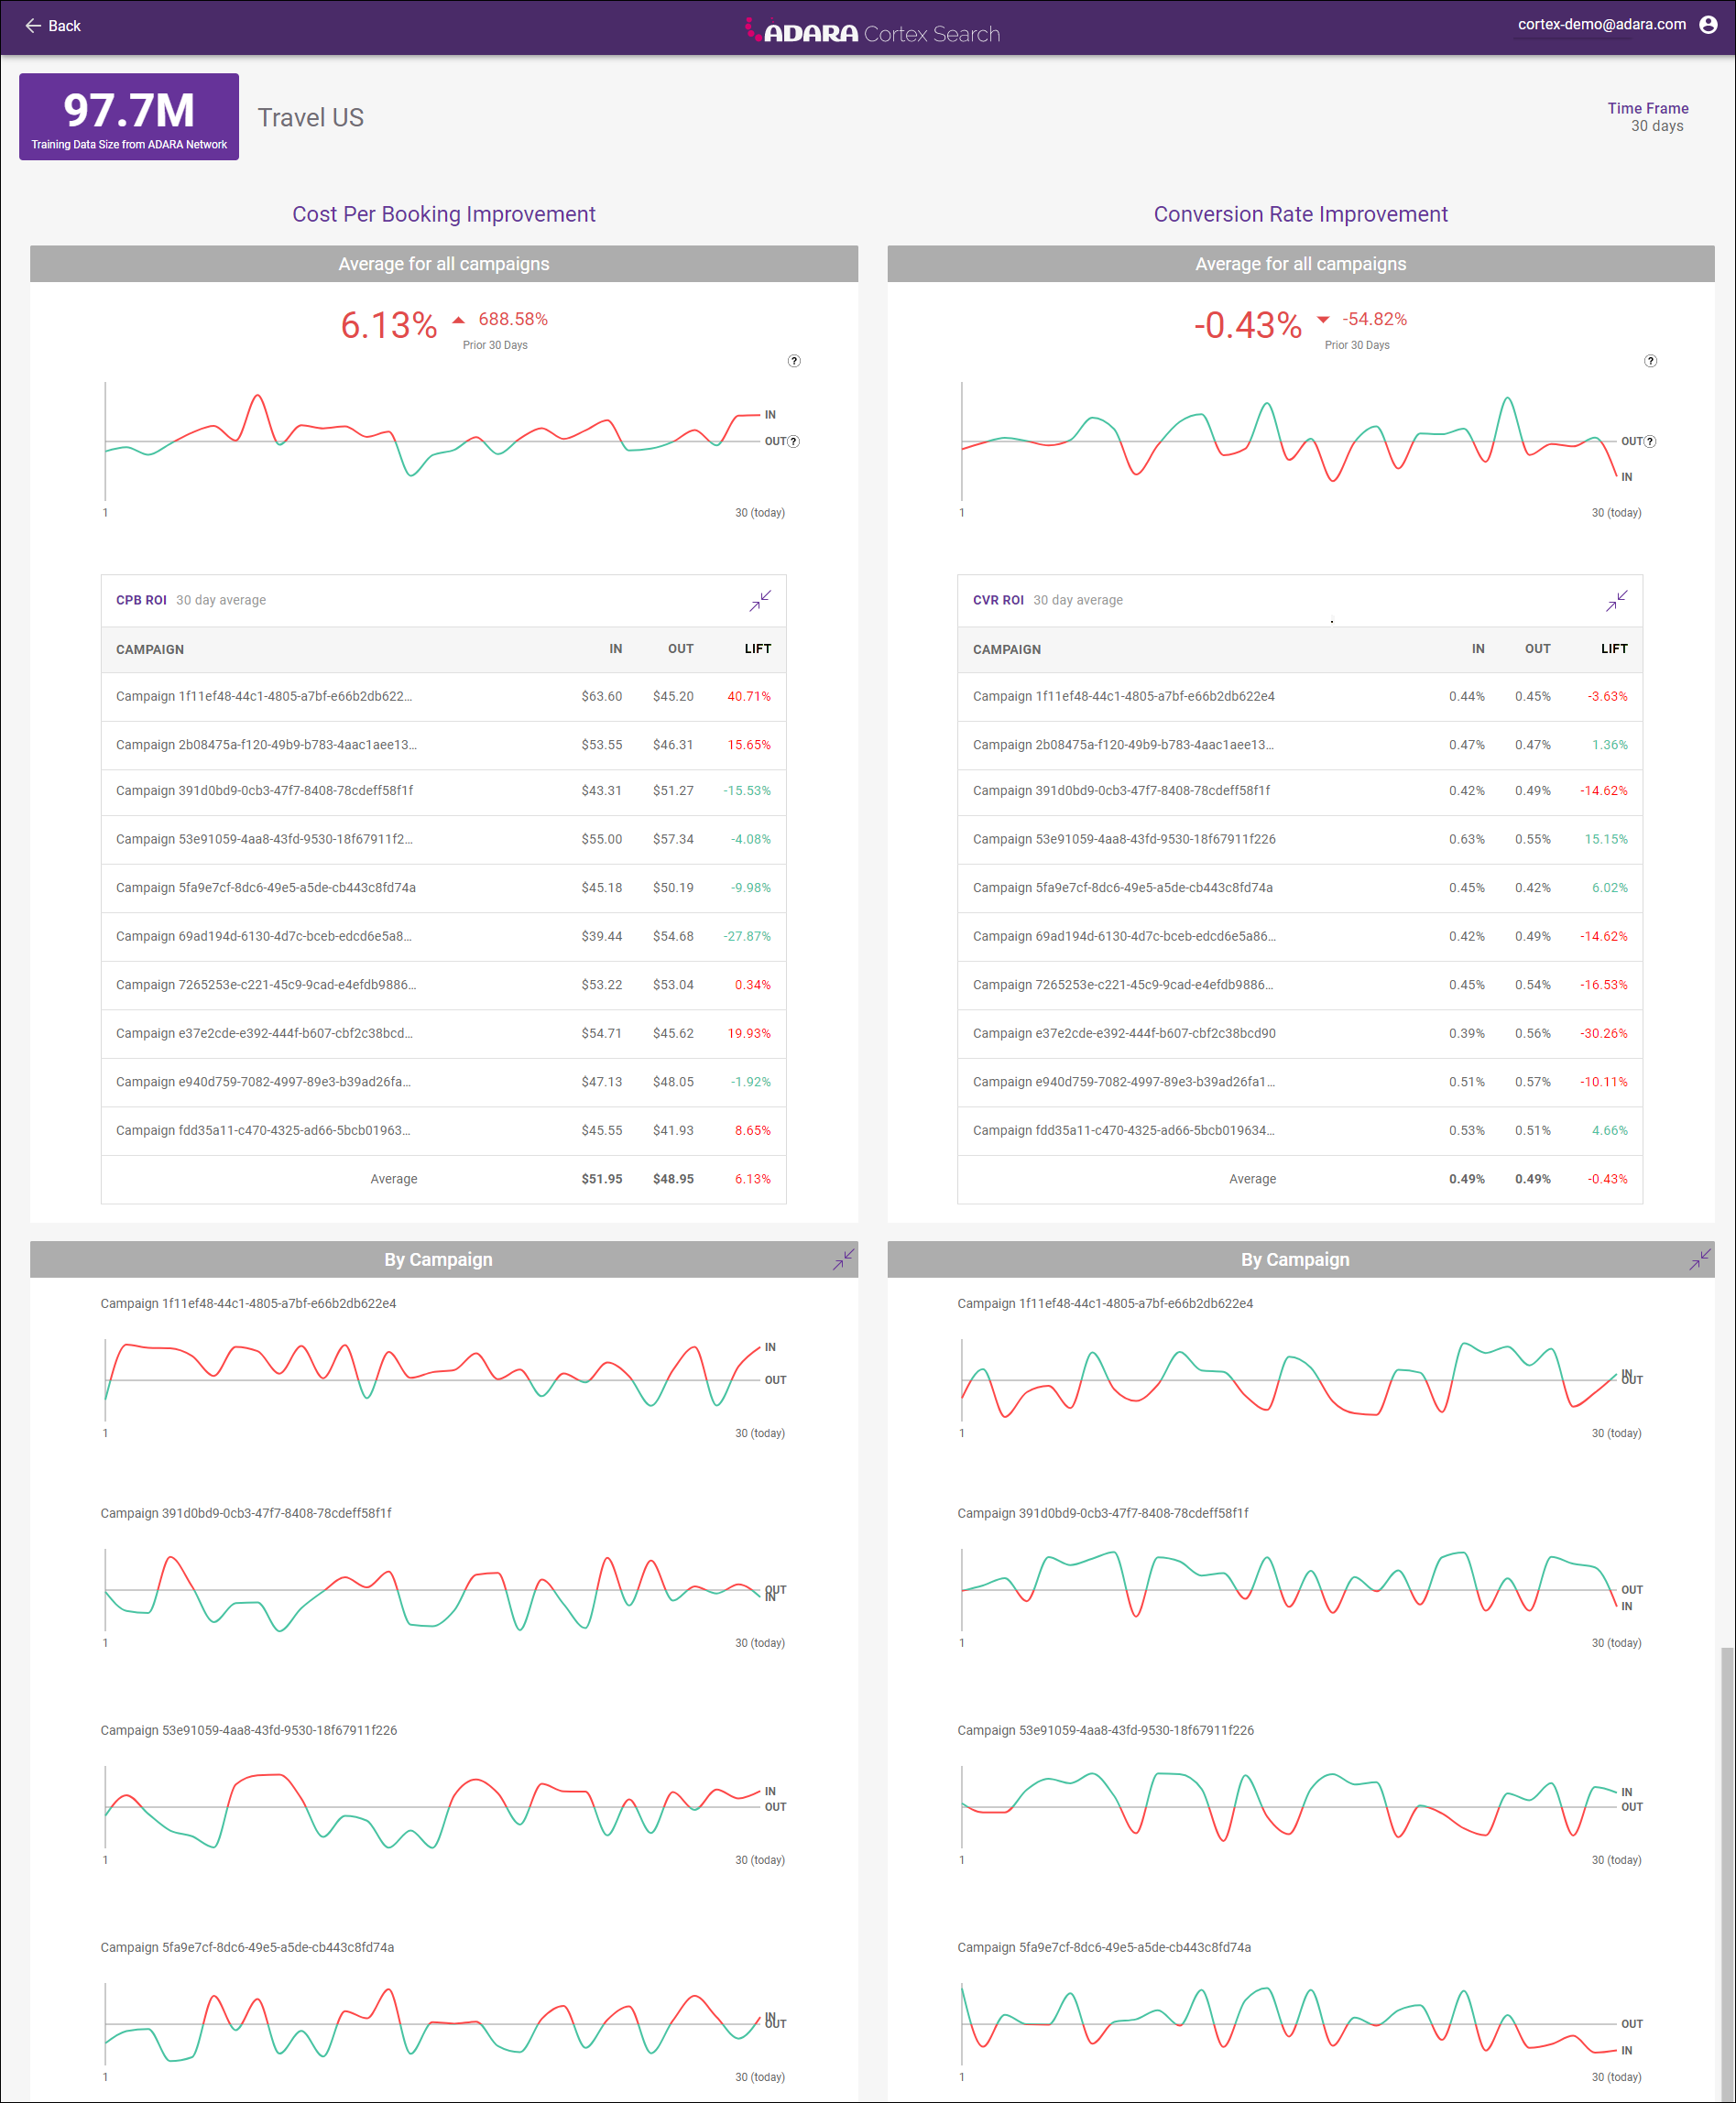
Once you apply a signal to a campaign, ADARA recommends using your existing monitoring methodologies to evaluate signal and campaign performance, allowing you to then tweak the result as you see fit. To help you with this, Cortex Search provides Lift Analysis of our signals. We show the daily performance of your selected audience (IN) compared to the 30-day average performance of all other audiences that are not provided by ADARA (OUT). These other audiences may include Google interest/affinity audiences, as well as any other user-lists you have added to you campaigns.
Cortex Search displays data in two general columns for Cost Per Booking Improvement and Conversion Rate Improvement as well as major rows showing Average for all campaigns and minor rows showing each component audience/signal in the selected campaign. Each column shows results for the overall group of campaigns, as well as the individual results for the component campaigns within that group.
For each column of graphs and tables:
Green indicates positive lift; red indicates negative lift.
For Conversion Rate (CVR), the goal is to drive the metric up.
For Cost Per Booking (CPB), the goal is to drive the metric down.
Hover over a graph to view the details for a segment of that graph. Select the two-arrows icon to collapse the campaigns for simpler viewing, then select again to expand and view the details of each campaign.
See C2.2. Signals Card (Analyze View) or C5. Lift Analysis for more information on the analysis options. Also see A6. Case Studies for more detailed and specific lift analysis case studies.
ADARA recommends the best practice of weekly checks to follow trends. This analysis can provide insights into specific campaigns that may need attention as well as the performance of the particular signals.