Media Traveler Profile contains 6 components and their data can be change by changing Advertiser, Date, Pixel groups and for 2 of them by switching between hotel and flight
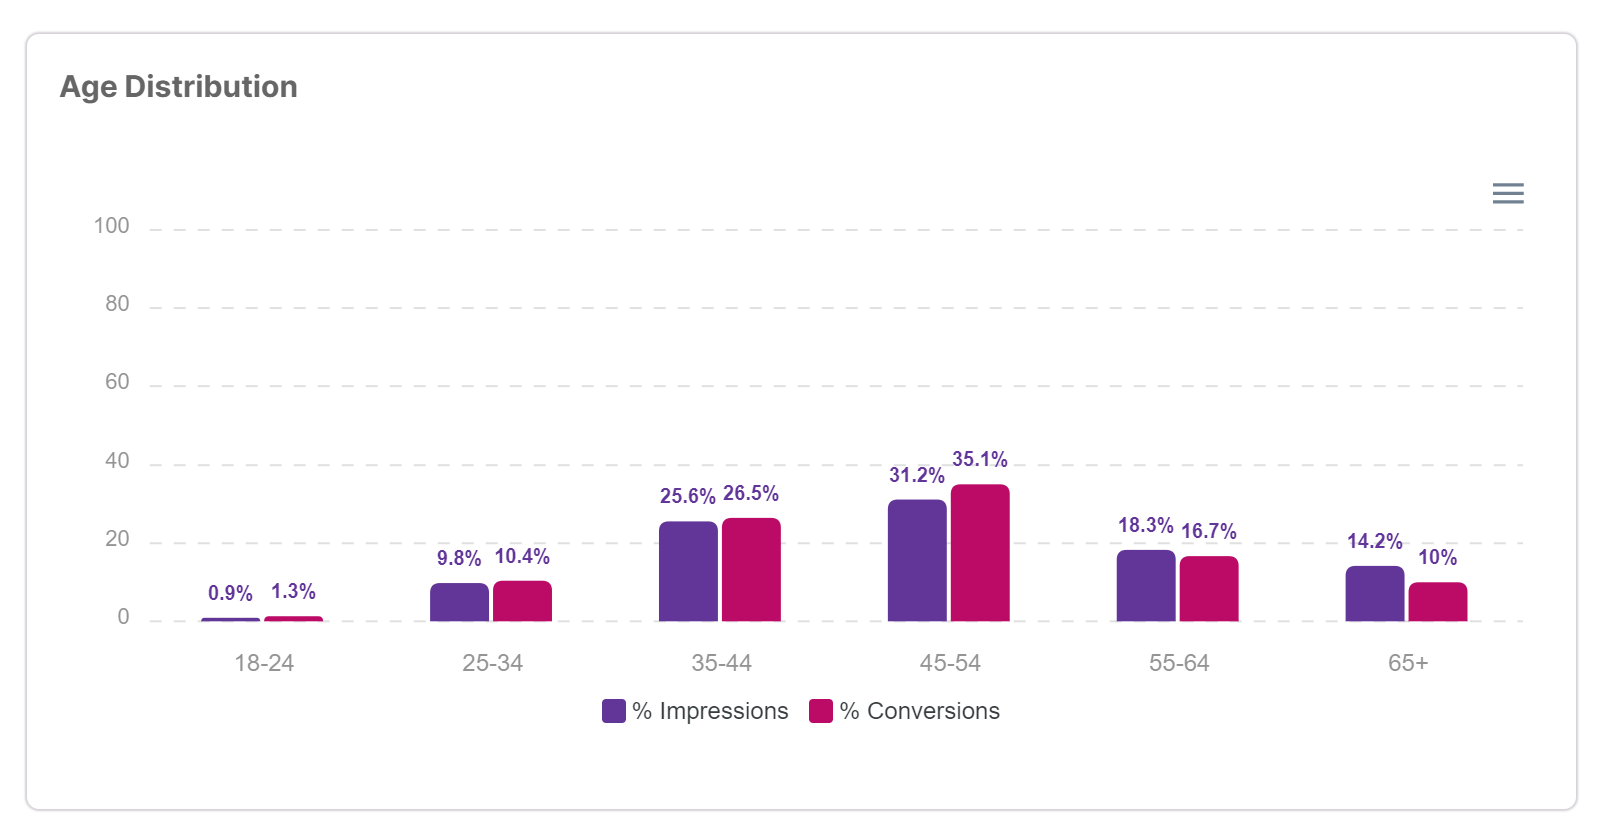
Age Distribution
What is this Insight showing? This Insight shows users the age distribution of travelers that saw your ad.
The age buckets are based on industry standard groupings used by marketing and advertising parties across the travel industry. Each traveler profile can only fall within a single age bucket.
How can this be useful?
This report helps users understand the age of travelers reached by their ads. Select different 'Pixel Groups' to see what age buckets are reached by each vendor on your media plan. Ensure this is aligned with your strategy.
Business vs Leisure
What is this Insight showing? This Insight shows the distribution of business travel vs leisure travel for those that saw users ad and booked to their market, based on all of their travel activity tracked across the ADARA ecosystem.
Business travel does not include a Friday or Saturday night stay. Leisure travel includes a Friday or Saturday stay, or both

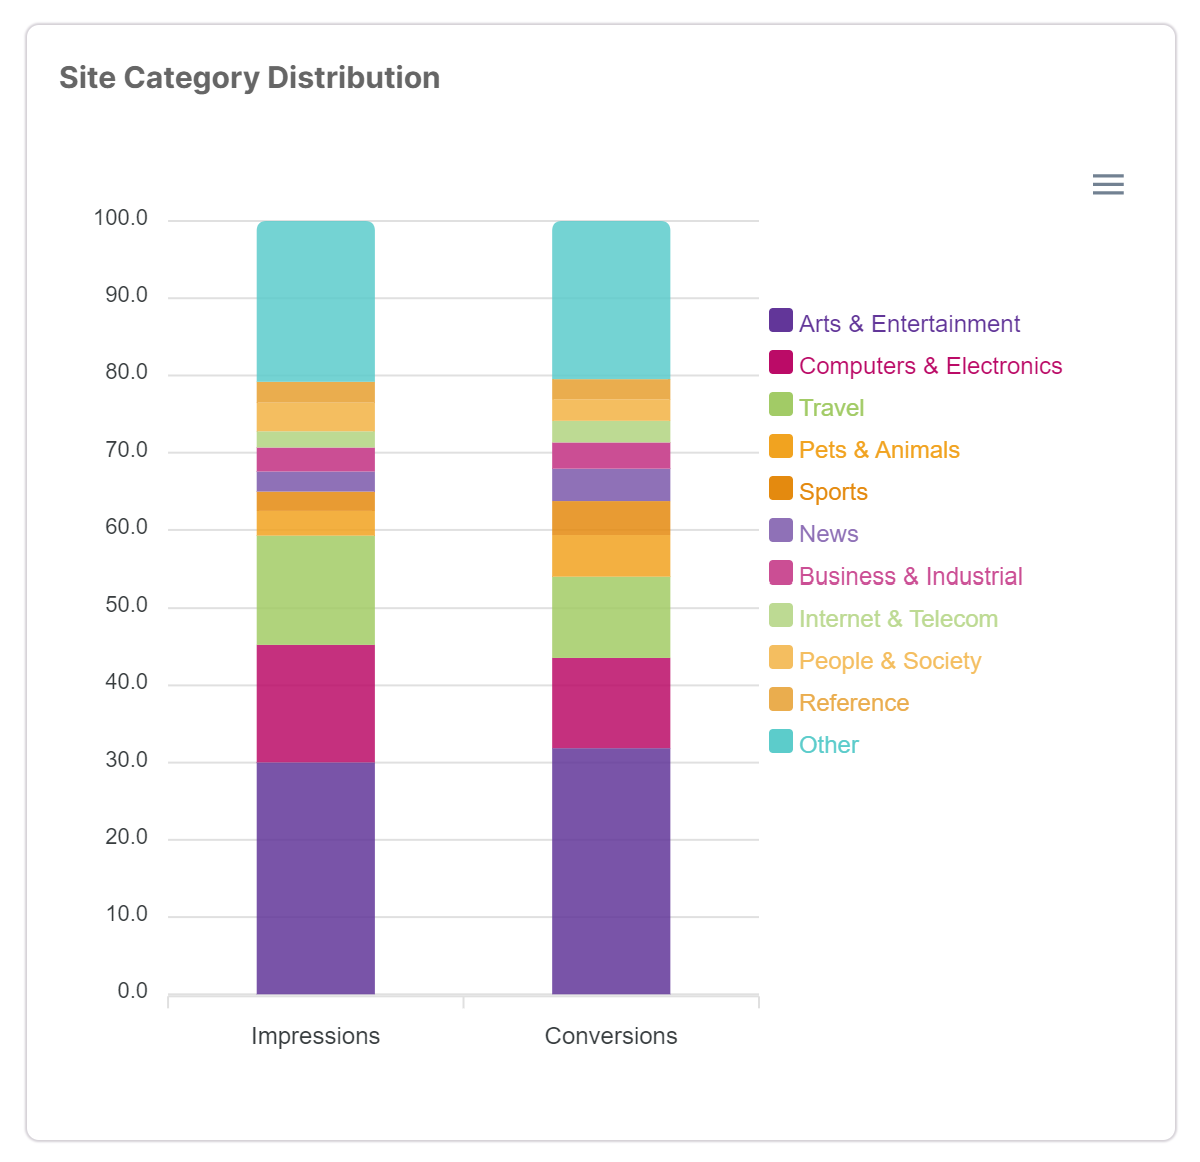
Site Category Distribution
What is this Insight showing? This Insight shows users the most popular categories of sites where travelers saw their ad.
The "Top 10" categories are based on a standard IAB site category list. All other impressions are grouped in a single 'Other' category.
How can this be useful? This report helps users understand the types of sites their ad is viewed on. Select different Pixel Groups to see what types of sites are used by each vendor on your media plan. Ensure this is aligned with your strategy.
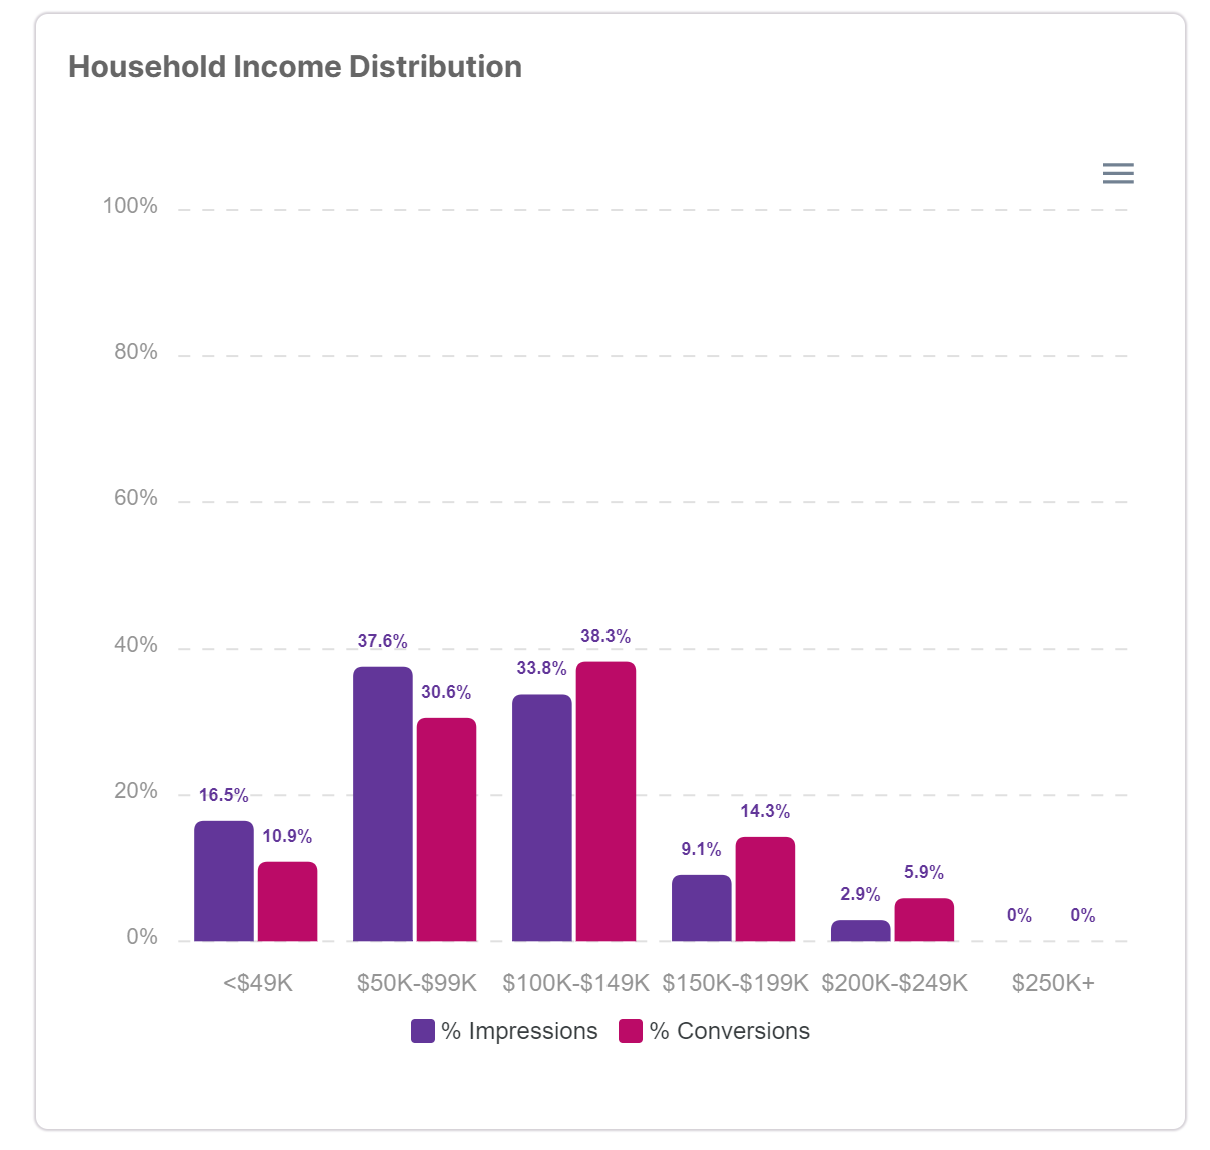
Household Income Distribution
What is this Insight showing? This Insight shows users the household income distribution of travelers that saw their ad.
The income buckets are based on industry standard groupings used by marketing and advertising parties across the travel industry. Each traveler profile can only fall within a single income bucket.
How can this be useful?
This report helps you understand the income of travelers reached by your ads. Select different 'Pixel Groups' to see what income buckets are reached by each vendor on your media plan. Ensure this is aligned with your strategy.
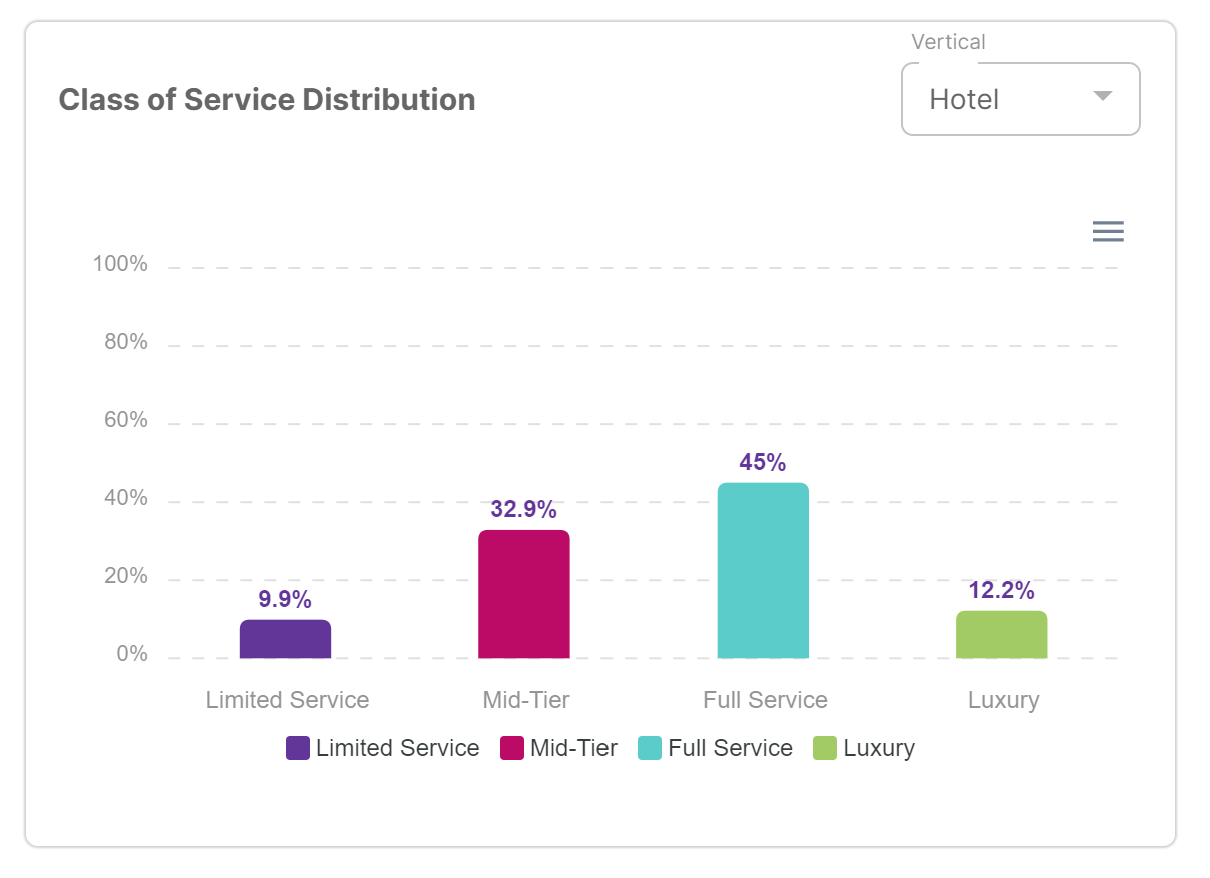
Class of Service Distribution
What is this Insight showing? This Insight shows users the breakdown of travel class by those that were exposed to their ad and booked to their market based on all of their travel activity across the entire ADARA ecosystem.
How can this be useful? This report helps you better understand affluence and in-market spend. Are you messaging and attracting travelers that book higher-end travel experiences and are likely to spend more time & money within your market?
How does this vary by campaign, season, or by Pixel Group?
While Hotel distribution is typically the starting point for this analysis, keep in mind that for some travelers you will see only their Flight travel and not their Hotel bookings, so you should balance what you find with Hotel class with Flight data as well.
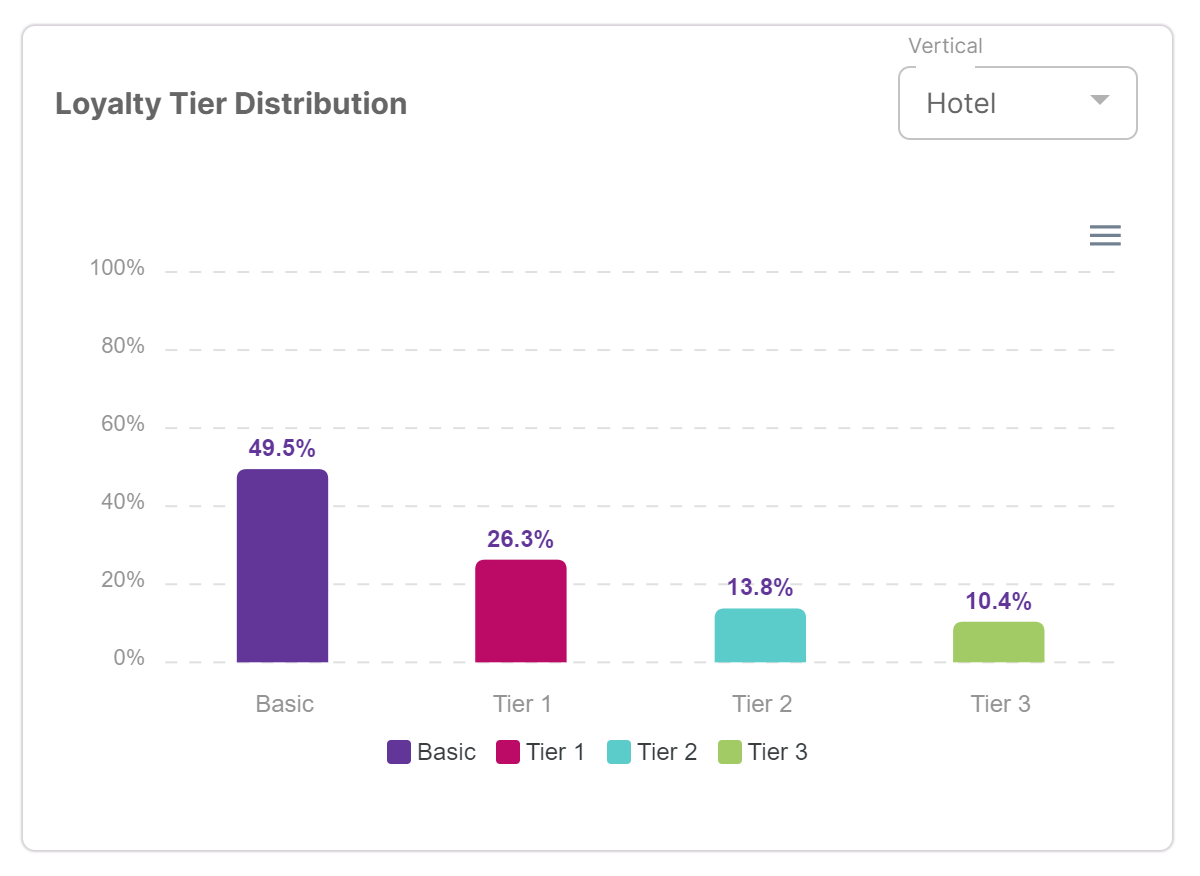
Loyalty Tier Distribution
What is this Insight showing me?
This Insight shows the distribution of loyalty tier membership for those that saw your ad and booked to your market, based on all of their travel activity tracked across the ADARA ecosystem.
The classification is based upon loyalty program membership data collected across the ADARA ecosystem. You can choose to examine airline loyalty data
by selecting "Flight" in the drop-down, or examine hotel loyalty data by selecting "Hotel".
Other Notes:
--Flight has 5 tiers while Hotel has 4 total tiers.
--Basic membership means a traveler has signed up for a program but has no "earned" status.
--Tier 1 is the first "earned" status milestone, Tier 2 is the second "earned" status milestone, and so on.
--For Hotel loyally programs, 3+ is the highest tier.
--For Flight programs, Tier 4 is the highest possible tier.
How can this be useful? This report tells you more about the frequency of travel for those visiting your market. Higher loyalty tiers suggest a more affluent traveler with more spend in-market as well as a more business-oriented traveler. This is especially true in the highest, most elite loyalty tiers which are dominated by business travelers. Note that these elite business travelers often vacation 2-3+ times per year on average as well.