Cortex displays signals cards under the Analyze tab with information and interface that is specific to active signals that have been previously selected and are currently being pushed for a client.
C2.2.1. Information
- The headline at the top of the card identifies the name of the signal and the potential numeric reach of the signal. This signal count will be populated once the signal is delivered successfully to the corresponding channel. If the signal name is truncated in length, hover over the name for two seconds to view the full-length name.
- Up to two chips can be displayed: the New chip identifies if the signal has been added within the last 90 days and the signal chip shows the type of signal (choices include Travel, Finance, Retail, Experiences, or Demographics). See C6. Signal Definitions for more details on industry-specific solutions.
- The center portion of the card shows either a grayed-out note that sufficient performance data is not yet available or a carousel with percentages showing the impact of this signal on 1.) a summary of cost per booking (CPB) and Conversion Rate (CVR), 2.) CPB graph, or 3.) CVR graph.
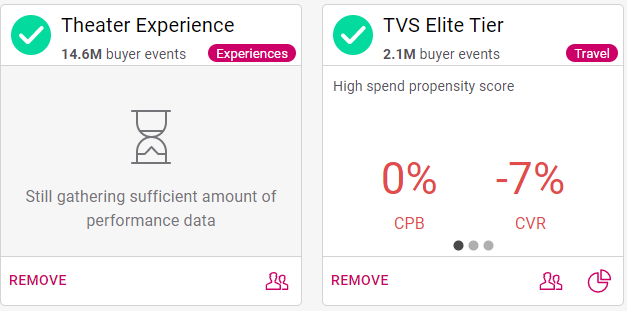
Cortex Search - Signal Detail for two signals under the Analyze Tab;
the left one indicates insufficient data, and the right one shows cost per booking (CPB) and Conversion Rate (CVR)
C2.2.2. Interface
- If sufficient performance data exists, the button carousel under the center of the card shows the impact of this signal on 1.) a summary of CPB and CVR, 2.) CPB graph, or 3.) CVR graph. Select the buttons to jump to specific carousel views. Alternately, hover to the right or to the left of the center of the card to show a directional arrow; select that arrow to cycle through the carousel views.
- Select Remove in the lower left of the card to remove this signal from Google Ads campaigns. This is essentially the opposite of activating a signal; for more information see Activate a Signal.
- Select the audience image in the lower right of the card to view the C3. Signal Insights Detail for this signal.
- If present, select the pie chart image in the lower right of the card to view the C5. Lift Analysis for this signal.
For context, here's the larger Analyze tab view again, with multiple signals displayed. These signals are currently being pushed for the advertiser/client currently being managed.
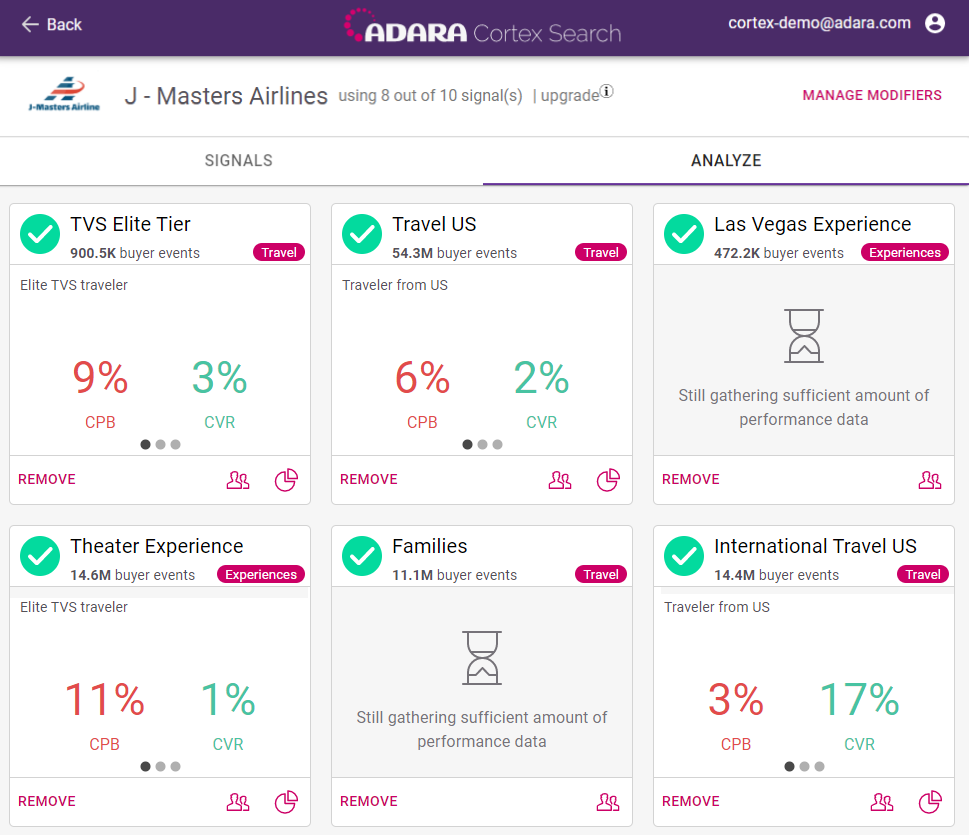
Cortex Search - Analyze Signal view for the selected client
Was this page helpful?