Site Impact Overview connects your website visitors to resulting travel activity, helping you to measure the effectiveness of your website and understand its role in inspiring travel to your market.
Filters and Options
Data Type - users can switch between Observed and Enriched
Website pixels - users can select specific website pixel
Key Metrics
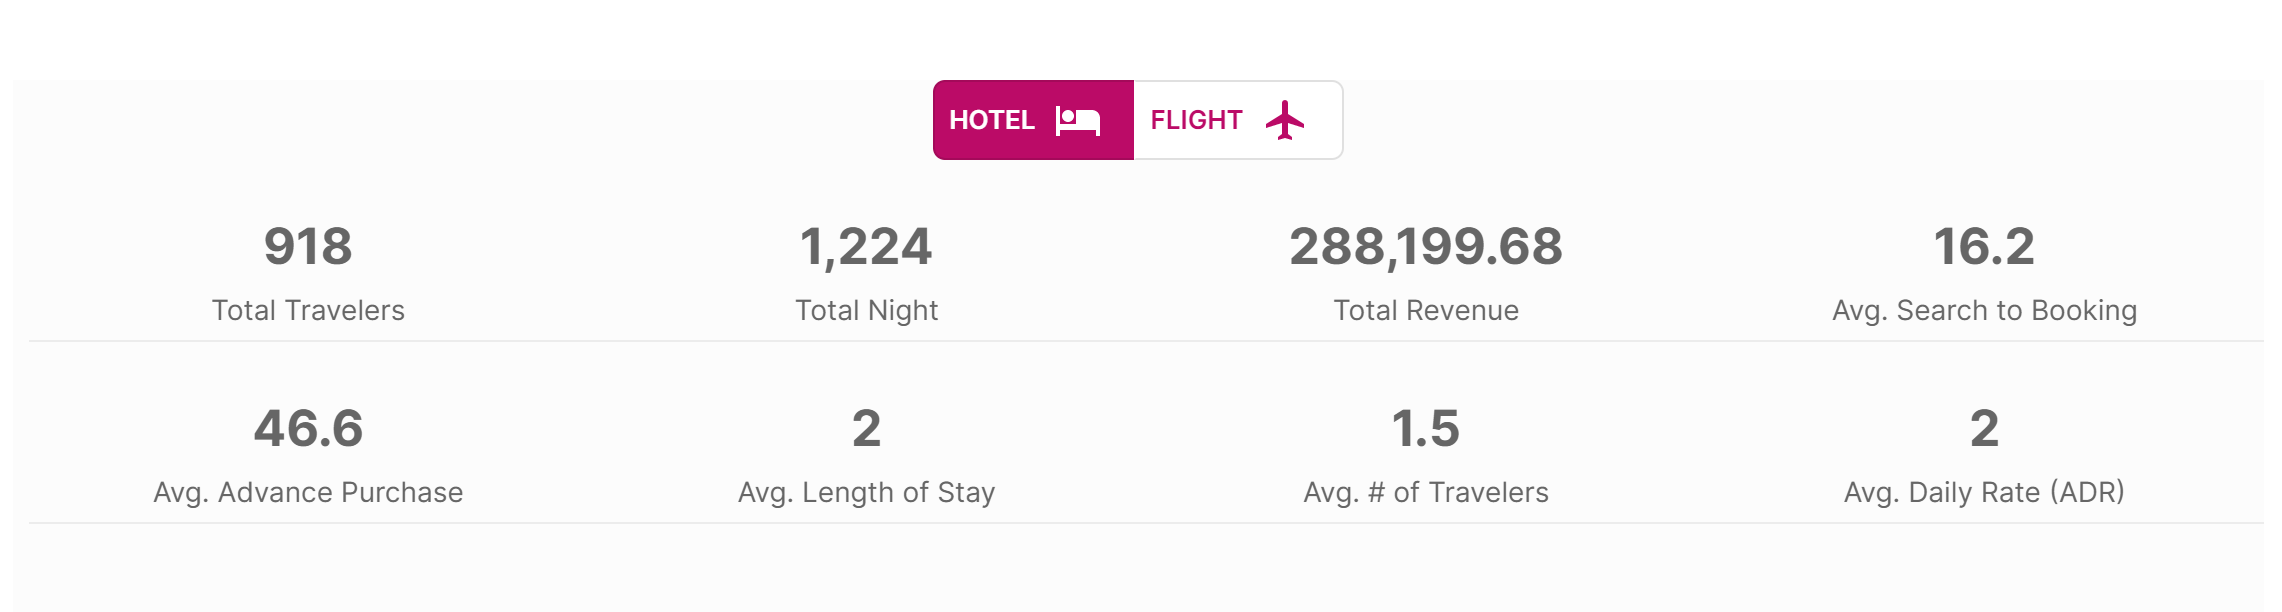
Toggle between Hotel and Flight data
Key Metrics
The top section of colored boxes are your key metrics. Purple boxes represent website activity and green boxes represent travel activity generated by website visitors after their website session. Click on a box to highlight that metric.

Site Visits
The total number of website visits by those that were exposed to at least one of your Impact-tracked advertisements.
This number represents the total number of website visits for the population exposed to advertising - if you have multiple websites, this includes site visits across all of those sites.
All site visits must occur within the attribution window after the last ad impression.
A "site visit" can include one or more page views
This number will not match any website analysis tools you may be using since it only counts website visits that occur after an Impact-tracked ad impression
You should disregard this 'Site Visits' metric for any row that represents an 'analytics pixel' that was placed on your website and not within paid media
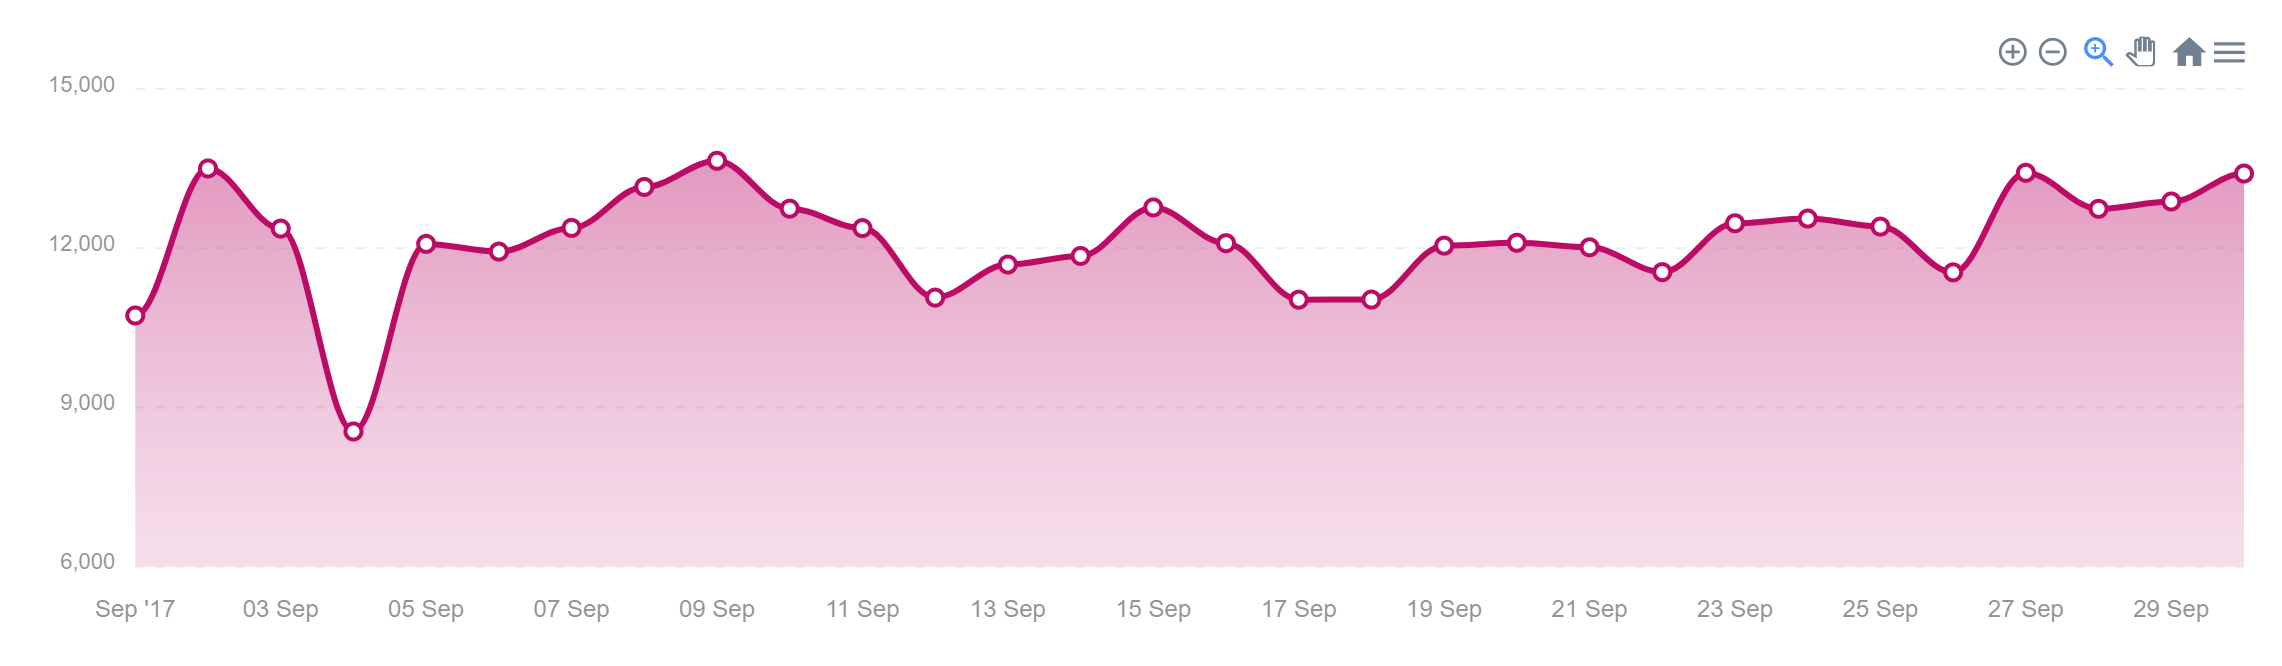
The line graph beneath the colored boxes will show the selected metric. Purple metrics will show only the date range selected, while green metrics will show the selected date range plus the "attribution window" configured for your market.
Sub Metrics
The numbers below the line graph provide additional insight into travel activity and visitation behaviors, including revenue estimates. The pink toggle with a bed and airplane icon lets you switch between sub-metrics for hotel activity and air activity respectively.